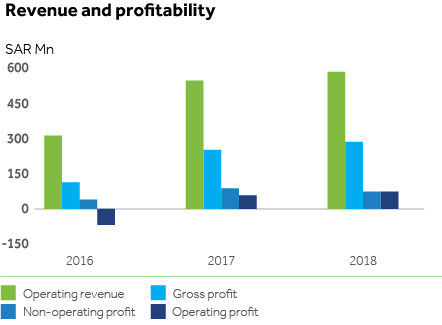
The operating revenue has increased by 6.9% from SAR 545 Mn in 2017 to SAR 583 Mn in 2018. The non-operating profit, which increased by 123% in 2017, declined by 15.8% from SAR 87 Mn to SAR 73 Mn in 2018.
The decline was mainly due to a drop in investment income. As a result, the net profit showed only a marginal increase of 2.0% from SAR 145 Mn to SAR 148 Mn.
Gross profit increased by 14% from SAR 250 Mn in 2017 to SAR 285 Mn, while operating profit showed a considerable increase of 29.2% from SAR 57 Mn to SAR 74 Mn.
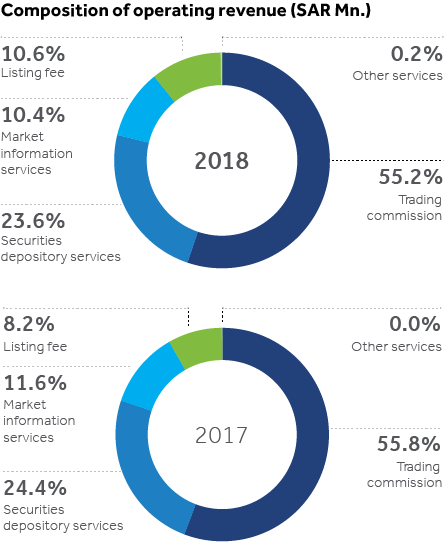
The composition of the operating revenue has shown little change from 2017 to 2018; a slight increase in trading revenue is mainly due to an increase in ADTV ( SAR 3.5 Bn in 2018; SAR 3.3 Bn in 2017). For non-trading revenue the increase has mainly been driven by the listing services stream. Listing revenue, which commenced in the 2nd quarter of 2017, has increased by 37% due to it being charged for the full year in 2018.
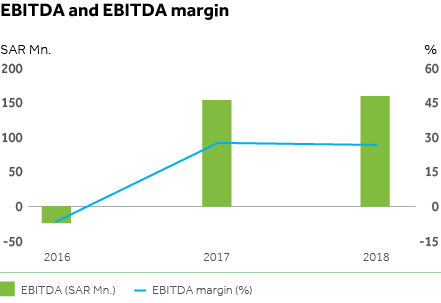
Operating costs increased by only 1% from SAR 295 Mn to SAR 299 Mn from 2017 to 2018. Over the same period, general and administrative expenses increased by 9.3% from SAR 193 Mn in 2017 to SAR 211 Mn in 2018. We have been successful in keeping the operational cost practically constant compared to 2017, despite the company carrying out critical projects and programmes of a transformational nature. The company is working to implement initiatives that contribute to controlling costs while increasing the growth of operating revenue, a reflection of operational efficiency. This is reflected in the disproportionate increase in gross profit and operating profit relative to operating revenue and also in the increase in gross profit/operating revenue.

Total assets increased by 4.0% from SAR 3,414 Mn in 2017 to SAR 3,532 Mn in 2018. However, there have been major compensating movements in the composition of non-current assets and current assets. Non-current assets declined by 62.1% to SAR 482 Mn (2017: SAR 1,270 Mn). Current assets increased by 42.3% from SAR 2,144 Mn to SAR 3,050 Mn. This has been largely due to the change in the composition of investments which were reclassified consequent to the adoption of IFRS.
Total non-current liabilities reduced from SAR 109 Mn in 2017 to SAR 89 Mn in 2018, which is a reduction of 18.1%. Total current liabilities increased by 77.1% from SAR 117 Mn to SAR 208 Mn.
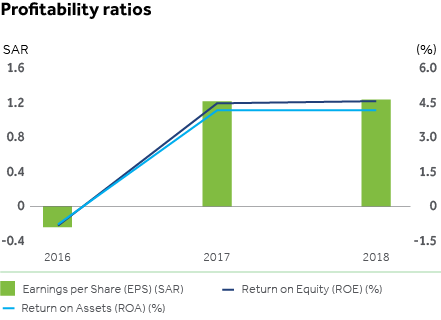
Total equity increased by 1.5% to SAR 3,235 Mn as at 31 December 2018 (2017: SAR 3,188 Mn). Return on equity remained unchanged at 4.61%. Return on assets marginally declined to 4.20% from 4.26% in 2017. Basic and diluted earnings per share increased marginally from SAR 1.21 to SAR 1.23.
 Print this Page
 Add to My Report
 Download this Page
 My Report
 Chart Gallery


